


Understand your data better and
make better decisions
QualiWare X 10.8 has new features to help you get to know your data better and make informed decisions.
Clustering: Identify patterns in your data
In QualiWare X 10.8, Clustering provides users with a new way of interacting with content in their repository.
Cluster analysis is a technique that can help identify patterns in data that may not be immediately apparent.
Clustering provides an enhanced analysis capability directly from the 3D Visualizer by logically grouping objects based on their relationships, concepts, and definitions.
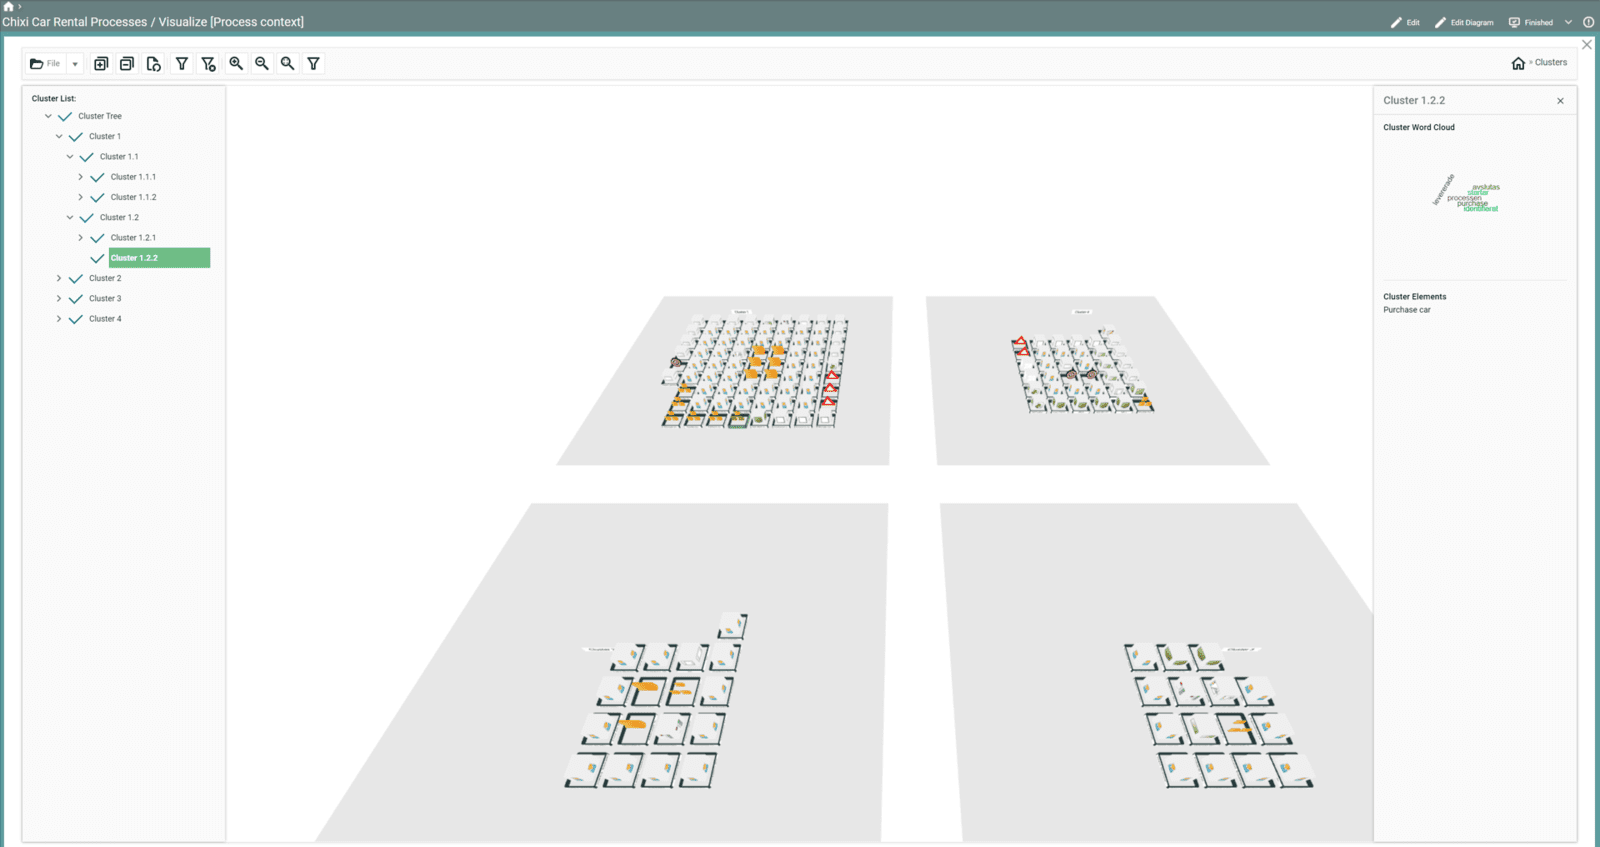
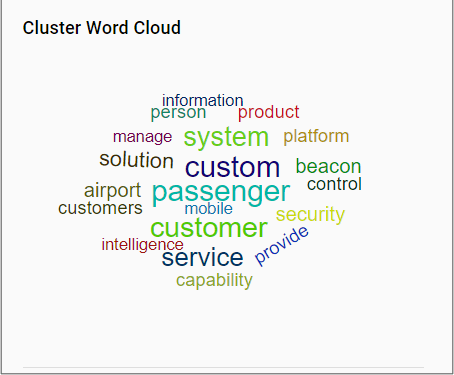
Users will also be provided with a word-cloud generated from various attributes of the objects in the cluster.
Cluster analysis can be a powerful tool for organizations to understand their data better and make more informed decisions regarding rationalization and transformation activities.
New and Improved Visualizations
New and Improved Visualizations
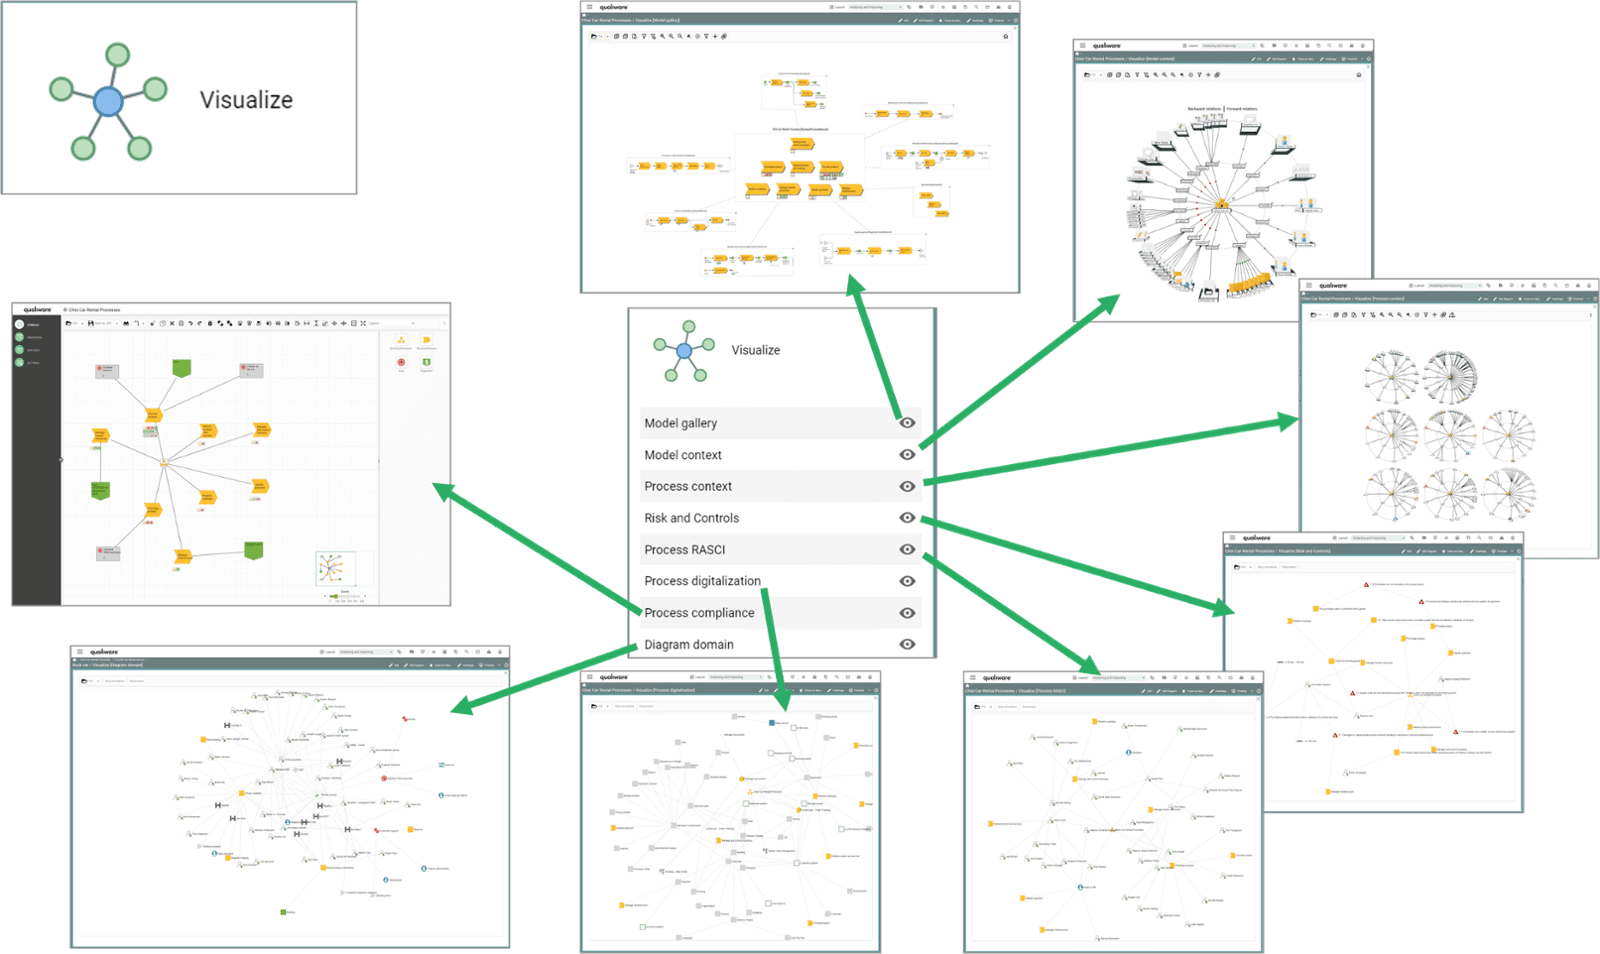
QualiWare X 10.8 has cool new and improved visualizer features to display and analyze data.
Organizations can benefit from 2D and 3D visualization in many ways:
Clarifying complex data
Visualizing data in a 2D or 3D format can make it easier to understand and interpret, especially when dealing with large or complex data sets.
Identifying trends and patterns
2D and 3D visualization can help identify trends and patterns in data that may not be immediately apparent, which can be useful for making informed decisions.
Communicating information effectively
2D and 3D visualization can effectively communicate data and analysis to others, such as stakeholders or team members, who may not have a technical background.
Enhancing decision-making
By visualizing data in a 2D and 3D format, QualiWare users can gain a clearer understanding of their data and use this information to inform decision-making.
Overall, these new and improved visualization features in QualiWare X 10.8 can help understand better and communicate data and analysis.
See all the new features in QualiWare X 10.8
Are you curious to know more about QualiWare X 10.8? Don't hesitate to visit our Center of Excellence, where you'll find videos, tutorials, and documentation about QualiWare X 10.8.

See QualiWare X 10.8 in action
Would you like to see the new features in QualiWare X 10.8 and learn how they can help you in your role - and your organization as a whole?
Don't hesitate to reach out to our experts.
